
Predictability in an unpredictable environment.
Since its inception, Blue Owl’s Real Estate platform, formerly known as Oak Street, has maintained the singular focus of providing attractive risk-adjusted returns through long-term, predictable cash flow by acquiring mission-critical real estate backed by investment grade and creditworthy entities. A triple net lease is a type of real estate lease in which a tenant is responsible for paying all of the property’s operating expenses on top of the base rent.

The strategy was purposefully constructed with strict investment parameters and the goal of providing clarity, downside protection, and the wherewithal to perform in varying economic environments. Recognizing the ongoing uncertainty in some markets and the more obvious challenges in others, the disruptions we are all facing provide a unique set of buying opportunities rarely seen during a market cycle. As we look to 2023, we are optimistic that our differentiated sourcing and ability to transact off-market will allow Blue Owl’s net lease strategies to take advantage of those rare opportunities we anticipate seeing this year.
Blue Owl's four investment themes for real estate in 2023
1. Sale-leaseback Super Bowl: The moment we have been waiting for
Over the last 10 years, the net lease institutional market has grown substantially in terms of scale and new entrants. Looking back at the net lease market 10-15 years ago, it was dominated by smaller closed-end funds, high net worth investors, and a group of REITs generally focused on assembling portfolios of retail assets. The major buyers today consist of larger Private Equity companies and larger funds. The buyer pool is continuing to expand rapidly as capital tends to move to more stable investments in increasingly unpredictable markets. In our view, as a result of current market disruptions, (i.e. rising interest rates, high inflation, supply chain issues, etc.), Blue Owl's Real Estate platform, formerly known as Oak Street, has been presented with the best buying opportunity we have experienced in years, possibly since inception.
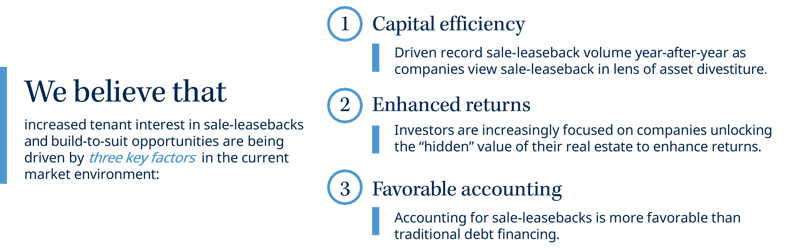
Sale-leaseback activity has already accelerated quickly given that commercial real estate and corporate cost of capital have converged. Average spreads on cap rates, the rate of return on a property based on the expected income generation, of BBB net lease assets vs. average BBB bonds resulted in ~240 bps of spread between 2014-2022. That spread is closer to 50 bps in today’s environment.1 Corporations can no longer access the cheap debt financing that had been available to them for years. Companies are facing substantially higher interest rates, which are more comparable with cap rates. As a result, our capital can be viewed more favorably relative to other avenues of financing than it has been in recent years. Many companies are now looking at sale-leasebacks as an additional capital alternative through the private market to finance their business initiatives or raise cash from a nonperforming asset in anticipation of an economic downturn. It is expected that companies will seek buyers that can provide greater scale, better speed, and more certainty of execution, as one-off deals continue to decrease in volume and companies focus their efforts on disposing of larger portfolios of assets. Corporations are more inclined to pursue a single solution in the private markets which offers a greater level of certainty compared to the public capital markets. Buyers who can source proprietarily and provide flexible capital should be able to meaningfully drive pricing, which is exactly what we believe our Net Lease strategies will be able to accomplish.
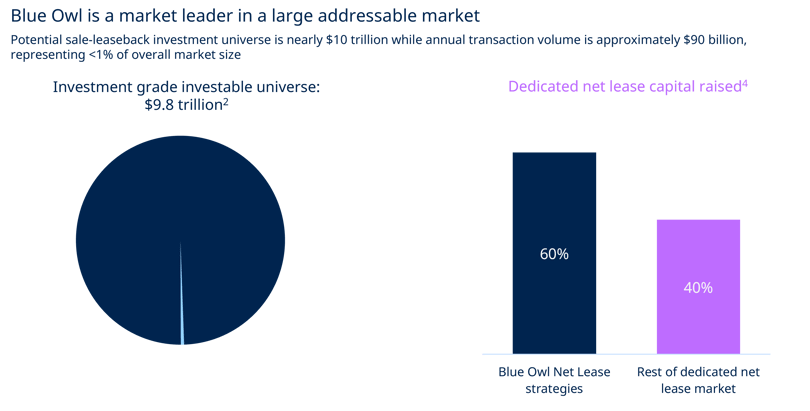
In 2020 and 2021, Blue Owl was one of the largest acquirers of traditional real estate in North America with $3.1 billion and $5.1 billion of total transaction volume, respectively. Over the past 12 months, we have closed or placed under contract $7+ billion of real estate and expect to continue that trajectory in 2023 given the favorable current environment and increased need for flexible capital. Our team feels strongly that the pipeline and deal sourcing process are sustainable for the foreseeable future, considering the sheer amount of quality direct investment opportunities currently available in the market. There is approximately $10 trillion of property, plant, and equipment (PP&E) that sits on the balance sheet of investment grade companies.2 While that figure is not fully comprised of real estate, we believe the vast majority of it is. The total net lease volume for 2021 was $90 billion which represents less than 1% of the overall market size.³ Our real estate division has raised approximately 60% of dedicated net lease capital and was a first mover in the net lease industry back when the firm launched in 2009. Moreover, we are convinced that the investible universe is massive and hardly tapped with respect to the opportunities available, despite our past successes and the recent growth in net lease funds.
2. Global supply chain disruption creates more opportunities onshore
An additional driver of the net lease pipeline has been companies looking to “onshore” or “reshore” their manufacturing facilities back to the US. Both the pandemic and geopolitical tensions have motivated companies to reduce their reliance on the global supply chains that proved to be vulnerable in recent years. Companies are turning their focus to economic self-sufficiency through security of supply and proximity to customers vs. overall cost. Automotive and technology companies have been at the forefront of the move as they look to create multi-billion-dollar plants for electric vehicle batteries, semiconductors, and memory chips. Some recent headlines include Intel announcing a $20 billion investment into two new semiconductor plants in Arizona, General Motors announcing a $4 billion investment to expand electric vehicle and battery production in Michigan, and Samsung announcing a $17 billion semiconductor plant in Texas. We believe we are well positioned to take advantage of similar opportunities in the near future.
3. The obvious factors at play
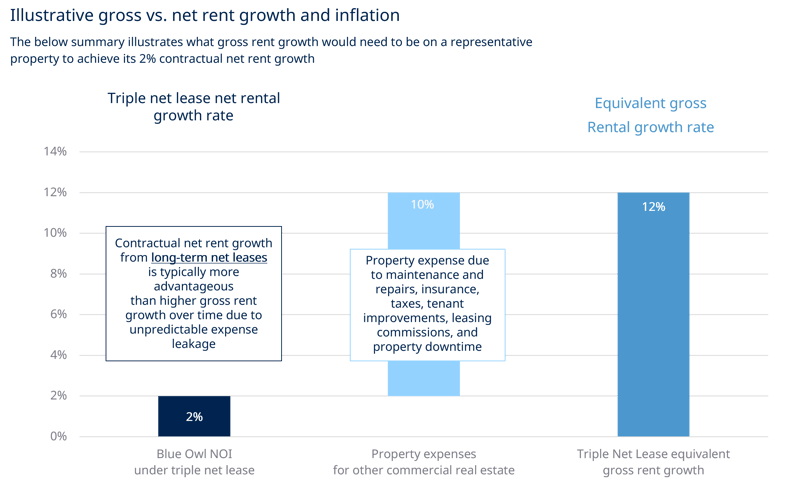
It would be difficult to discuss the economic outlook today without addressing rising interest rates and inflation. While some companies are better positioned to navigate these headwinds, no companies are immune from their impact, and in fact, we have seen large multi-national companies affected by the results of increased supply chain and labor costs. The challenges facing large multi-national companies highlight the uniqueness of our investment strategy as one of the few businesses with cash flows that should largely be unaffected by inflationary pressures. Given that 100% of our cash flows from net rent are contractual with all financing costs fixed, we have full clarity on cash flow, even in inflationary or other uncertain times such as the COVID-19 pandemic where our tenants paid 100% of rent in cash and on time.5 The average commercial real estate investment in the US will carry an annual CapEx cost equivalent to 16% of net operating income, further reducing the overall net yield.6 Our strategy does not incur any CapEx costs due to the triple net lease (NNN) structure of our assets and fixed financing, which enhances predictability scenarios that are not commonly seen in investing.
Furthermore, our portfolio of real estate assets also carry annual net rent growth of ~2% on average, providing a compelling hedge against inflation throughout almost any long-term economic cycle. Not only is gross rental income increasing every year, but the triple-net lease structure of our investments completely insulates us from rising expense growth (utilities, taxes, maintenance, property-level tenant improvements—all of which would be expected to grow in line, or even outpace inflation). Recent data shows that construction prices have increased 41% since February 20207, labor costs have risen by 5.2% since September 20218, and commercial property insurance rates increased by 9% in 2021.9 We view the common argument that you can “push” higher rents on short-term leased commercial real estate such as multifamily or SFR to be misguided—we believe net rent growth under a net lease is more attractive than net rent growth under a gross lease on a risk-adjusted basis over time. The gross lease will carry substantially more risk of expense leakage particularly in an inflationary environment.
Further, in an inflationary environment, there tends to be cracks in the credit markets. We believe there are few investments more risk-off than physical real estate with long-term contractual income produced by an investment grade tenant with in-place contractual growth.
4. Debt is the new equity: continuing to get creative
Following an incredibly active start to 2022, banks have pulled back as a result of the ongoing market volatility and ongoing concerns around higher interest rates. Lenders have tightened their underwriting standards, incorporated stricter terms, and are exercising caution over which deals they choose to finance. This environment has forced companies to seek out alternative forms of financing.
While the cost of financing has risen, we have been able to maintain our cash yield by deploying at even more attractive valuations than we have seen historically. Since inception, our weighted average entry cap rate has been at least 100 bps above today’s US Commercial Real Estate Market average cap rate.10 The current market environment has allowed for more favorable lease enhancements such as higher rent growth and longer lease term. Further, we expect to maintain the same transaction-level and fund-level leverage of ~60% loan-to-cost (LTC), and we have no expectations of deviating. Given cash yield remains intact and leverage levels are consistent with historic levels, covenants are not expected to change in any notable way. Our real estate team has developed strong relationships with numerous lenders and has the ability to not only tap traditional mortgage debt but also to finance deals utilizing our fund facility, through commercial mortgage backed security (CMBS) and asset backed security (ABS) issuances, as well as through private placement notes.
Although benchmark rates and spreads are increasing this year, leveraging interest rate swaps when floating rate debt is employed can help maintain reasonable cost of debt and hedge against rate risk. We also believe there is room for spreads to come in tighter over the next year. By focusing on long-term, fixed-rate bank balance sheet loans when we underwrite an investment, there is clarity regarding the cost of debt for the duration of the targeted investment hold period. Compared with investors that use floating rate debt, we are able to provide attractive certainty of cash flow during the investment hold period, which tends to be extremely valuable to investors as they manage and forecast their own cash flows. The long-term, fixed-rate nature of the debt allows our strategy to withstand market cycles with strong predictability of cash flows during the investment hold period. More importantly, the ability to buy at higher cap rates in the current environment helps us absorb the increased debt costs.
In conclusion...
Recognizing that there are a number of macro challenges and various disruptions at work in the markets today, this environment continues to be one of the most attractive buying opportunities for net lease real estate strategies. The need for high credit quality companies to partner with flexible and reliable capital providers is greater and we believe this puts us in a position to be the partner of choice due to our scale, proprietary sourcing, speed, and certainty of execution.
Net lease strategies can be leveraged to weather various economic cycles due to the strong underlying tenant quality, more favorable acquisition pricing, and triple net lease structures.
We continue to believe that Blue Owl’s unique and differentiated real estate strategy is poised to outperform in any economic environment.
Wishing you all a happy new year and a successful 2023.

Marc Zahr
Co-President & Head of Real Estate, Blue Owl Capital

Past performance is not a guarantee of future results. The views and opinions expressed herein are those of Blue Owl and are subject to change as markets and other conditions fluctuate. Blue Owl is under no obligation to update or keep current the information presented.
Please see endnotes and important information at the end of this page.

